CPT
software
Import a sounding, check the data and get graphs, soil behaviour type and layers in one place, next to the boreholes, SPT and DPT tests of the same project.
Import.
Then Check.
Load CPT data from CSV or Excel and review every point in a table, with the point count, depth range and cone resistance summary on top.
- ✓CSV and Excel import
- ✓Every data point in a table
- ✓Export to CSV or XLSX
Depth m | qc MPa | fs MPa | u2 kPa |
|---|---|---|---|
| 0.020 | 0.797 | 0.0267 | 14.5 |
| 0.040 | 0.802 | 0.0267 | 20.1 |
| 0.060 | 0.811 | 0.0273 | 10.0 |
| 0.080 | 0.823 | 0.0276 | 19.3 |
| 0.100 | 0.823 | 0.0272 | 17.1 |
| 0.120 | 0.820 | 0.0274 | 20.1 |
| 0.140 | 0.814 | 0.0269 | 17.7 |
| 0.160 | 0.809 | 0.0266 | 17.9 |
| 0.180 | 0.812 | 0.0269 | 19.4 |
| 0.200 | 0.814 | 0.0270 | 17.1 |
| 0.220 | 0.811 | 0.0272 | 15.4 |
| 0.240 | 0.805 | 0.0280 | 14.0 |
| 0.260 | 0.802 | 0.0275 | 20.1 |
| 0.280 | 0.800 | 0.0276 | 11.1 |
| 0.300 | 0.803 | 0.0280 | 11.8 |
| 0.320 | 0.816 | 0.0279 | 16.4 |
| 0.340 | 0.804 | 0.0267 | 17.9 |
| 0.360 | 0.800 | 0.0264 | 12.6 |
| 0.380 | 0.775 | 0.0254 | 14.3 |
| 0.400 | 0.763 | 0.0247 | 21.4 |
| 0.420 | 0.756 | 0.0247 | 12.4 |
| 0.440 | 0.772 | 0.0259 | 10.8 |
| 0.460 | 0.761 | 0.0257 | 10.5 |
| 0.480 | 0.751 | 0.0255 | 15.9 |
| 0.500 | 0.736 | 0.0251 | 15.8 |
Every Curve.
On the Log.
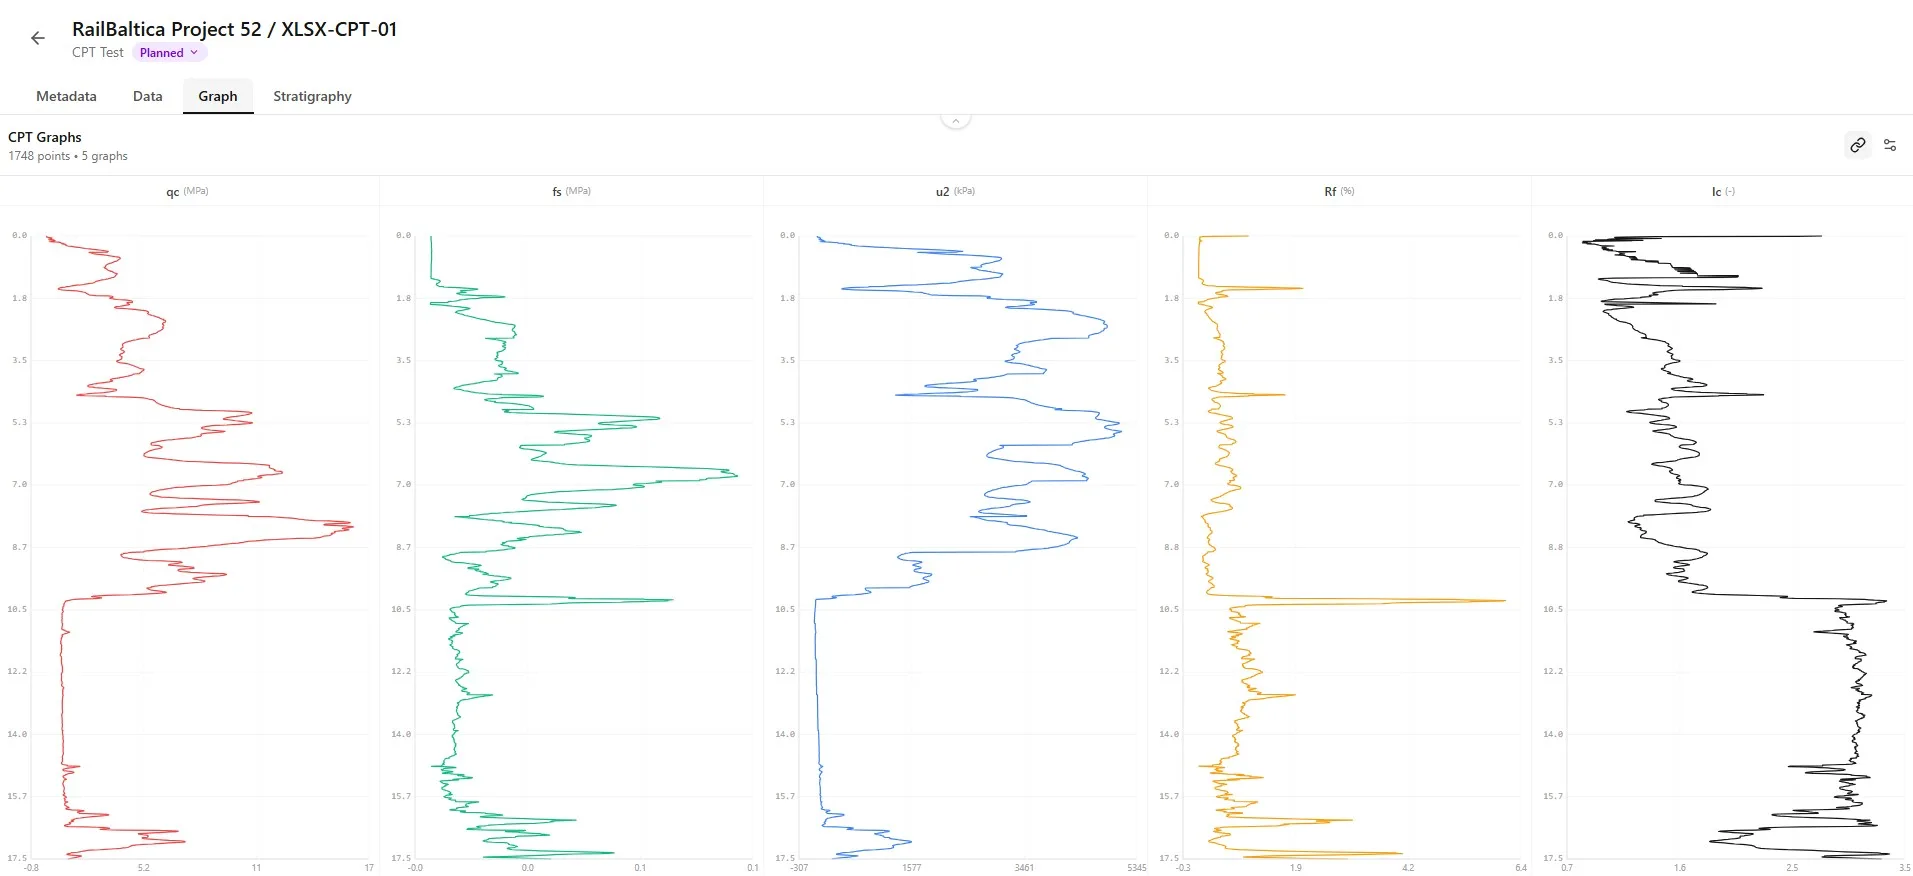
Plot cone resistance, sleeve friction and pore pressure against depth together with corrected and derived values, and put them on the PDF log next to the layers.
- ✓qc, fs, u2 and Rf against depth
- ✓qt, σ'v0 and Fr
- ✓Ic, N60 and moduli on the PDF
Layers from Ic.
Ready to Review.
Borebase splits the sounding into layers from the soil behaviour type index Ic and names them, with average qc, fs, Rf, Ic, N60, Su and M for each layer. Review them before they go on the log.
- ✓Automatic layers from Ic
- ✓Averages for every layer
- ✓ISO 14688-1 soil names
Point at a layer or the graph to see the layer's averages
Derived Values.
Open Formulas.
Corrected cone resistance qt, soil behaviour type, N60 equivalent, undrained shear strength Su and constrained modulus M are calculated for every point. The CPT methodology guide lists each formula.
- ✓qt, Ic and soil behaviour type
- ✓N60 equivalent and Su
- ✓Moduli M and E
Depth m | qt MPa | Ic | SBTn | N60 | Su kPa | M MPa |
|---|---|---|---|---|---|---|
| 0.500 | 0.739 | 2.35 | Clayey silt to silty clay | 2 | 60.8 | 5.8 |
| 1.000 | 0.639 | 2.55 | Clayey silt to silty clay | 2 | 51.6 | 5.0 |
| 1.500 | 0.624 | 2.67 | Silty clay | 1 | 39.7 | 4.8 |
| 2.000 | 0.556 | 2.78 | Silty clay | 1 | 34.5 | 4.1 |
| 2.500 | 1.889 | 2.15 | Clayey silt to silty clay | 5 | 153.5 | 25.2 |
| 3.000 | 0.630 | 2.84 | Silty clay | 2 | 38.2 | 4.6 |
| 3.500 | 0.295 | 3.23 | Low-plastic clay | 1 | 12.8 | 1.3 |
| 4.000 | 0.331 | 3.26 | Low-plastic clay | 1 | 14.3 | 1.5 |
| 4.500 | 0.349 | 3.32 | Low-plastic clay | 1 | 14.8 | 1.5 |
| 5.000 | 0.397 | 3.28 | Low-plastic clay | 1 | 16.9 | 1.8 |
| 5.500 | 4.312 | 1.91 | Sandy silt / silty sand | 10 | - | 42.6 |
| 6.000 | 4.823 | 1.88 | Sandy silt / silty sand | 11 | - | 45.8 |
| 6.500 | 5.219 | 1.89 | Sandy silt / silty sand | 12 | - | 50.0 |
| 7.000 | 5.755 | 1.86 | Sandy silt / silty sand | 13 | - | 53.6 |
| 7.500 | 5.538 | 1.90 | Sandy silt / silty sand | 12 | - | 53.7 |
| 8.000 | 6.563 | 1.90 | Sandy silt / silty sand | 15 | - | 63.7 |
| 8.500 | 10.703 | 1.68 | Sandy silt / silty sand | 24 | - | 80.0 |
| 9.000 | 0.930 | 3.16 | Low-plastic clay | 3 | 42.4 | 6.1 |
| 9.500 | 18.492 | 1.44 | Compact sand to silty sand | 37 | - | 102.6 |
| 10.000 | 15.840 | 1.55 | Slightly silty sand | 32 | - | 99.8 |
| 10.500 | 17.370 | 1.51 | Slightly silty sand | 35 | - | 104.8 |
| 11.000 | 20.328 | 1.48 | Slightly silty sand | 41 | - | 118.4 |
| 11.500 | 18.953 | 1.56 | Slightly silty sand | 38 | - | 122.0 |
| 12.000 | 21.980 | 1.54 | Slightly silty sand | 44 | - | 136.9 |
| 12.500 | 22.919 | 1.51 | Slightly silty sand | 46 | - | 138.4 |
| 13.000 | 25.128 | 1.49 | Slightly silty sand | 50 | - | 146.9 |
| 13.500 | 24.336 | 1.55 | Slightly silty sand | 49 | - | 153.4 |
SPT and DPT.
Same Project.
Keep SPT and dynamic probing tests with their graphs next to the CPTs, and export each of them to CSV or XLSX.
- ✓N, N60 and N1 graphs
- ✓Dynamic probing tests
- ✓CSV and XLSX export
More in Borebase
Try It on
Your Own Project.
Create a project, add your boreholes and soundings, and export the first report.
No credit card · takes 2 minutes